For a random project, I was interested to see if there a way to pass data between R and JavaScript. My purpose was to populate a Highcharts graph dynamically using preprocessed data from R. Of course, my first look was rCharts, an R package to create and publish interactive JavaScript visualizations, which also support the Highcharts for building interactive graphs and plots. The rCharts is a great package and widely popular among R users to create interactive charts without knowing the underlying JavaScript.
My requirement was not only the interactive chart but also dynamic that can create chart on near real time as shown in Highcharts demo. It seems to me that rCharts neither provide a straightforward way to add-point on series nor a way to customize the JavaScript to create such dynamic charts. As far as I know, it has limitations (or out of context of rCharts philosophy) for doing sophisticated jobs that requires JavaScript customization. At this moment it only supports the 24 functions from Highcharts API through R interface.
1. server.R – To generate dynamic data. It also works as basic web server.
 # server.R
 shinyServer(function(input, output, session) {
      #global varible on x-axis
      x <- 0
      # Generate a new random variable object and send it back to the client
      # handler function called 'SendObjectToClientDynamicCallbackHandler'
      autoUpdate <- reactiveTimer(1000,session)
      observe({
           autoUpdate()
           x <<- x + 10
           y = runif(1)
           #pass data to client as object - x & y are passed to client from server on every second
           variableToPassClient = sprintf('{"X":"%s",
              "Y": "%s"
              }', x, y)
           session$sendCustomMessage(type="SendObjectToClientDynamicCallbackHandler",variableToPassClient)
      })
 })
2. ui.R – To build an user interface in HTML
 # ui.R
 shinyUI( bootstrapPage(
   tags$script(src = "https://code.highcharts.com/highcharts.js"),
   tags$script(src = "https://code.highcharts.com/modules/exporting.js"),
  # handler to receive data from server
   tags$script('
   var dataFromServer;
   Shiny.addCustomMessageHandler("SendObjectToClientDynamicCallbackHandler",
    function(variables) {
     dataFromServer = variables;
    });
  '),
   # handler to receive custom data
   tags$div(id ="container", style ="min-width: 310px; height: 400px; top:200px; position: relative"),
   includeScript("charts.js")
 ))
3. Charts.js – Java Script code for building interactive and dynamic HighCharts
$(function () {
$(document).ready(function () {
var initialData=[];
getVariableX = function(){
var aaa= JSON.parse(dataFromServer);
return parseInt(aaa.X)};
getVariableY = function(){
var bbb = JSON.parse(dataFromServer);
return bbb.Y*100+1;};
Highcharts.setOptions({
global: {
useUTC: false,
pointStart:0
}
});
$('#container').highcharts({
chart: {
pointStart:'0',
type: 'spline',
animation: Highcharts.svg, // don't animate in old IE
marginRight: 10,
events: {
load: function () {
// set up the updating of the chart each second
var series = this.series[0];
setInterval(function () {
series.addPoint([getVariableX(),getVariableY()], true, true);
}, 1000);
}
}
},
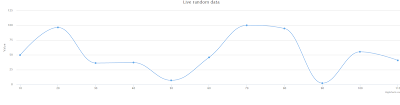
title: {
text: 'Live random data'
},
xAxis: {
type: 'integer',
tickPixelInterval: 150,
},
yAxis: {
title: {
text: 'Value'
},
plotLines: [{
value: 0,
width: 1,
color: '#808080'
}]
},
tooltip: {
formatter: function () {
return '<b>' + this.series.name + '</b><br/>' +
'X: '+Highcharts.numberFormat(this.x,2) + '<br/>' +
'Y: '+Highcharts.numberFormat(this.y, 2);
}
},
legend: {
enabled: false
},
exporting: {
enabled: false
},
series: [{
name: 'Random data',
data: (function () {
// generate an array of random data for initial setup
for(var i = -10;i<=0;i++){
initialData.push({
x: i,
y: Math.random()
});
}
return initialData;
}())
}]
});
});
});
Step 1: Install packages
install.packages('shiny')
Step 2: Load libraries
library(shiny)
Step 3: Execute the shiny root folder
a. Download and put charts.js,server.R and ui.R in a folder named 'myDynamicShinyCharts'
b. runApp('myDynamicShinyCharts')
The whole project is also hosted on github.
References:
https://github.com/ramnathv/rCharts/blob/master/inst/libraries/highcharts/examples.R
http://api.highcharts.com/highcharts#Series.addPoint
https://ryouready.wordpress.com/2013/11/20/sending-data-from-client-to-server-and-back-using-shiny/
http://rstudio.github.io/shiny/tutorial/#inputs-and-outputs


0 comments :
Post a Comment